Factors Increasing Quality Grades in U.S. Fed Cattle
by Paul Dykstra, Beef Cattle Specialist, Certified Angus Beef LLC
Background
The history of beef marbling and quality grade trends in the U.S. is marked by functional shifts in the way quality grades are assigned as well as economically driven cattle management enhancements. As recently as 2005, the beef industry faced concerns surrounding beef demand due to the lack of marbling (i.e. desirable quality grade) in a considerable percentage of the product mix, with the share of Choice graded carcasses dropping to 57.2%. (Corah and McCully, 2010).
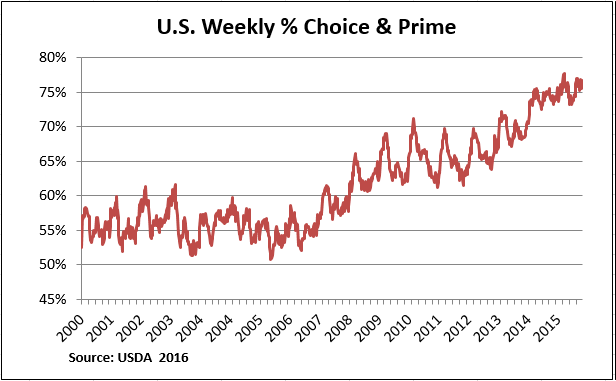
Beginning in 2007, the industry saw annual advances, with the exception of 2012, in the percentage of fed cattle carcasses grading Choice (Figure 1). The 2006 average of 51.7% Choice remarkably improved to a 2015 average of 69.1%, a 17.4 percentage-point improvement. While the Prime grade had endured for years in the 2% to 3.5% range, that premium grade also jumped to 4.2% in 2014 and 5.1% in 2015.
Figure 1.
While quality grade levels in the 1970s and 1980s were much higher than in 2015, it is important to note that not all carcasses were offered by packers for grading by USDA in those years. Instead, carcasses not likely to grade Choice or Prime were simply marked as “No Roll,” meaning they were not “rolled” with a quality grade stamp (Zimmerman, 2016). This is in stark contrast to industry norms in the modern era where nearly all fed steer and heifers carcasses are assigned a quality grade, creating a more realistic total assessment of the quality grade mix of carcasses and a more challenging field when it comes to Choice as a percentage of the whole.
In 2006, USDA initially approved instrument grading for quality grades (Belk and Woerner, 2008) and, after adjustment of quality grade lines to match those assigned by field graders, the technology was adopted by industry in 2009. USDA goals were to improve consistency and accuracy of grading with instrumentation and to remove some of the divergence in human grade assignments (USDA, 2006). The change ushered in a new era of trend analysis in beef grading.
While the functionality of USDA grading practices is important to gaining a better appreciation of the history of quality grade improvements over a broad timeline, it does not explain the improvement in quality grade that has been so dramatic since the adoption of instrument grading in 2009. To that end we must look to cattle management and genetic factors for further explanation.
Economic Shift in Feeding Management
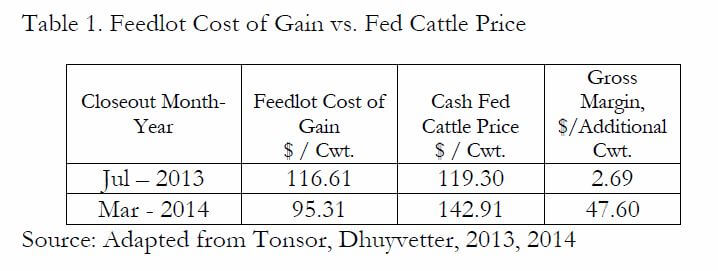
The economics of cattle feeding shifted significantly in the summer of 2013. The price of corn entered a precipitous decline from $7.14/bushel for the week of July 8, 2013 to $4.56/bushel for the week of September 23, 2013 (USDA). This decline, and the concomitant decline in the price of corn distiller’s byproducts, created a historically wide gap between feedlot cost of gain and the cash live cattle price (Tonsor, Dhuyvetter, 2013, 2014). Kansas feedlot survey data shows steer close-outs in July 2013 had a cost of gain $2.91/cwt. under the cash fed cattle price at that time (Table 1). Steers fed in the 5 months following the completed downward adjustment in corn price, closed out in March of 2014, posted a cost of gain $47.60/cwt. lower than the cash fed cattle price.
Table 1. Feedlot Cost of Gain vs. Fed Cattle Price
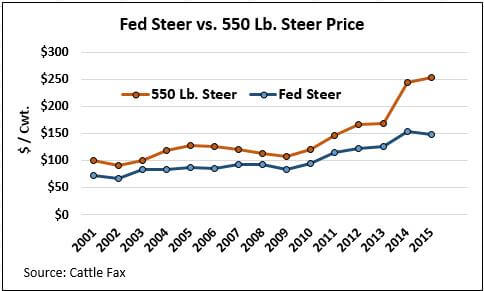
The second factor driving the gap between cost of gain and fed cattle price was the beginning of a marked increase in fed cattle prices, which were range-bound between $112/cwt. and $130/cwt. from June 2011 to June 2013 (Figure 2). In October 2013, prices moved into the $130s for just 12 documented weeks before moving consistently higher throughout 2014 to reach $171.38/cwt. the week of November 24, 2014.
Figure 2.
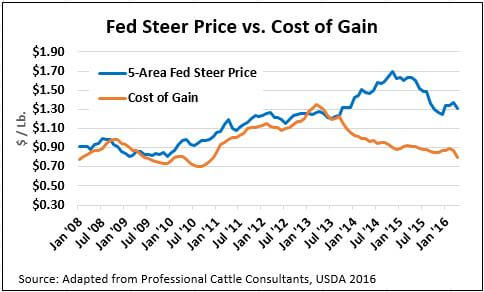
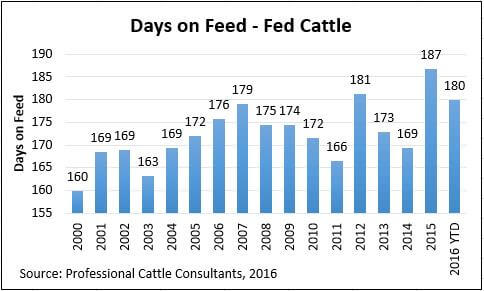
Although fed cattle prices moved much lower late in 2015, as low as $116.64/cwt. the week of December 14th, corn prices also moved lower, averaging $3.59/bu. from July 2014 to December 2015. The combined impact of significantly elevated fed cattle prices and reduced corn prices (i.e. ration cost) created an inequality in the cost of feedlot gain versus the value of each additional pound of fed cattle weight not seen in recent history (Walter, Professional Cattle Consultants, 2016; USDA, 2016). As a result, feedlots had incentive from late 2014 through early 2016 to feed cattle longer, compared to the period preceding this (Figure 3, Professional Cattle Consultants, 2016).
Figure 3.
As seen in Figure 4, comparing annual carcass weights against quality grades, % Choice and Prime carcasses trend in line with the annual carcass weight increase since 2007, implying a correlation between heavier carcass weights and higher marbling scores (USDA, 2016).
Figure 4.
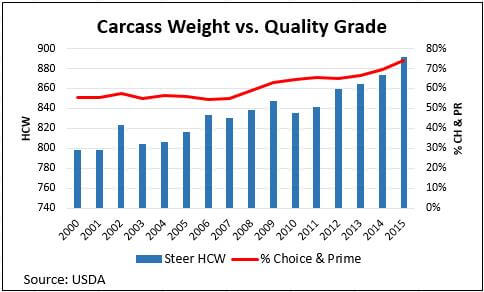
A meta-analysis of the impact of feedlot management and nutrition on carcass measurements of fed cattle (Owens and Gardner, 2000) showed that both additional days on feed and heavier carcass weights are associated with higher marbling levels and quality grades. This substantiates the industry trend that indicates increasing carcass weights and days on feed factor into the improved carcass quality grade levels in the past decade.
Further economic considerations at the feedlot level influenced fed cattle marketing decisions as the impact of the shrinking cow herd post-2012 hit home. As fed cattle prices rapidly increased and the availability of replacement cattle to fill feedlot pens tightened, the value of calves and feeder cattle responded to reach historical highs. Calf and feeder cattle prices increased to a level such that the ability of feedyards to purchase cattle at a breakeven or profitable price was so diminished that many opted to feed fewer cattle rather than purchase cattle that appeared, at the onset, to have sizeable risk of economic loss (Figure 4; Cattle Fax, 2016). Further scrutiny in lending by financial institutions after the housing market collapse of 2008 played a role by decreasing the ability of cattle feeders to obtain their desired level of credit due to the equity required per head.
Figure 4.
The logical management option was to increase days on feed (Figure 5) for the cattle inventory already in place and, at times, avoiding further ill-advised purchases simply to maintain a critical mass of cattle in the feedyard (Zimmerman, 2016 communication). This factor, coupled with the relationship between cost of gain and fed cattle prices, further encouraged heavier carcass weights. A 1987 review by Streeter, et. al., discussing growth, carcass characteristics and feeding economics points out several feeding trials linking days on feed and heavier carcass weights with increasing marbling scores and occurrences of USDA yield grade (YG) 4 and 5 carcasses. As a result, one can conclude a correlation to increased quality grades of Choice and Prime as well as higher numerical yield grades during the period beginning mid-2014 through late fall 2015, when days on feed were increased substantially above year-ago feeding durations.
Figure 5.
Source: CattleFax
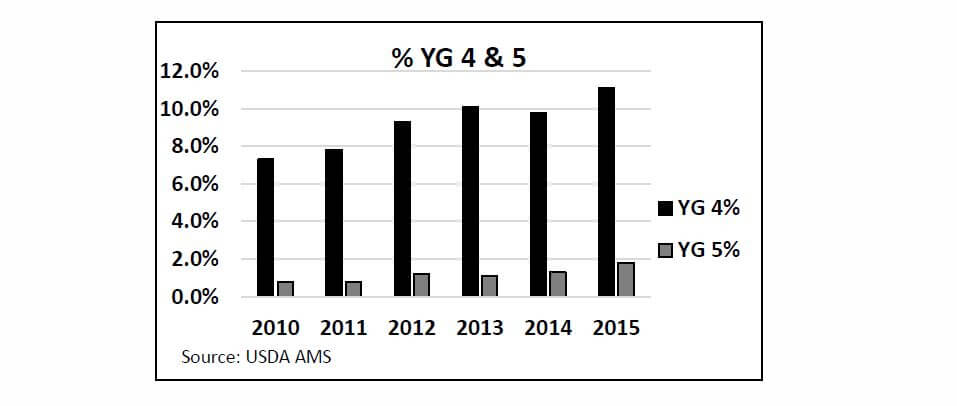
Further compositional changes are noted in the YG data (Figure 6) as a result of heavier carcass weights, magnified by added days on feed beginning in the second half of 2014 through 2015. As displayed in the graph, YG 4 and 5 cattle increased from 2010 through 2015. Carcass weight increases during this period align nicely with YG increases while days on feed are less closely tied in 2013, specifically, to the YG 4 and 5 advances. Heavier cattle were not discouraged by packers during this period owing to the shortage of fed cattle in the supply chain in 2014-2015 due to drought-induced culling in the two-plus years prior. Furthermore, the strong boxed beef price incentives for higher quality grades, including Premium Choice branded and Prime products, pushed packers to pursue longer-fed cattle that would achieve higher percentages of these grade and brand categories.
Figure 6.
In the wake of smaller fed cattle supplies, packers were forced to seek their production volume through heavier carcass weights rather than larger head counts. Packing firms then relaxed their YG 4 and, in some cases, YG 5 grid and formula discounts to encourage feeders to add the necessary weight to cattle to achieve the same tonnage production. For instance, YG 4 discounts typically seen from $10/cwt. to $15/cwt. were replaced with a range from $5/cwt. to $10/cwt. Packers that had not previously provided an allowance for YG 4 carcasses implemented a grid structure where discounts weren’t imposed until a given marketing group of cattle surpassed the packing plant average percentage of YG 4s.
As well, upper carcass weight limits were increased in these pricing arrangements, further encouraging added pounds. The previously common upper carcass weight threshold of 1,000 lb.,above which discounts were imposed, was increased, ranging from 1,050 lb. to 1,075 lb., depending on the packer. Other measures were taken in feeder/packer pricing arrangements to increase allowed percentages of YG 4 and “heavy” carcasses on harvested groups of cattle to ease the discount burden. Packer competition during 2014-2015 to simply capture the necessary weekly supply of fed cattle was quite high, as evidenced by the highest fed cattle prices in history.
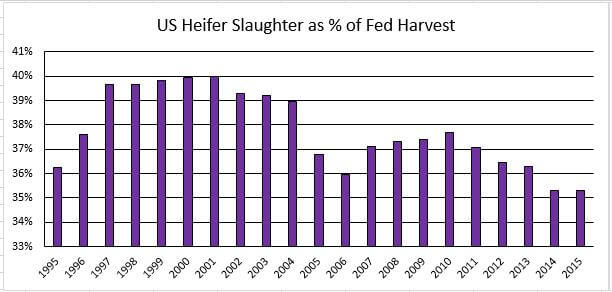
The cyclical nature of the U.S. beef cow herd is also relevant to the discussion of marbling trends. As producers retain a greater number of replacement heifers in herd expansion years, we see a resulting decline in the percentage of heifers in the fed cattle population. As well, studies show that heifers tend to have a marbling advantage over steers and tend to achieve higher grading percentages (Corah and McCully, 2006). Data beginning in 1995 (Figure 7) illustrates the cyclical percentage of heifers in the fed harvest since 2001. The low point in 2006 corresponds with a low in fed cattle quality grade trends as well. Yet the continuous increase in fed cattle quality grades since 2006 has occurred despite another cycle of cow herd expansion and fewer heifers in the fed mix. This suggests other factors impacting marbling were more influential in the past decade.
Source: USDA, NASS
At the 2007 Beef Improvement Federation meeting, data was shared from the Vetlife Benchmark database (Anderson and Gleghorn, 2007). The authors point out that, despite increasing days on feed, heavier carcass weights and higher percentages of carcasses receiving USDA YG 4 and 5 in the years 2000 to 2006, quality grades did not increase. This suggests that simply making the cattle fatter and heavier during that specific time period was not enough to improve marbling. The authors further explain several non-genetic factors that contribute to marbling level, which for the most part have remained relatively constant with the exception of practices noted in this paper. Both carcass weight and days on feed continued to increase subsequent to 2006, above previous levels, along with a marked increase in quality grades during the next decade. While carcass weight and days on feed have been shown to affect marbling, genetic improvement is a significant additive factor.
Genetic Advancement
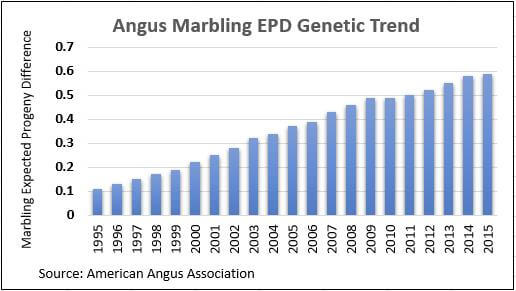
One must give ample credit to both seedstock and commercial cattle producers in the analysis of marbling improvement over the past 20 years. As grid marketing tools for fed cattle continue to feature price incentives for Choice, Certified Angus Beef ® brand and Prime grading carcasses, producers in every sector have responded to that demand by incorporating marbling selection in their breeding plans. Marbling is a moderately to highly heritable genetic trait with scientific estimates averaging 0.45 heritability (Herring, 2006). Thus, as compared to less heritable traits, selection for marbling, where implemented, has rapidly advanced marbling levels. Consequently, positive selection pressure for marbling by the seedstock industry as well as demand for higher marbling genetics from the commercial sector has led to significant marbling advancements in the Angus breed and others. The American Angus Association’s historical trend for marbling expected progeny difference (EPD) indicates that from 1995 to 2015 the average marbling EPD for Angus cattle improved by 0.55 marbling units (Figure 8).
Figure 8.
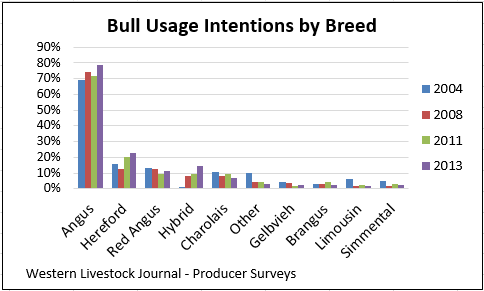
The impact of the Angus breed on the U.S. beef cattle population continues to grow, as noted in the bull turnout data collected by Western Livestock Journal (Figure 9). In a survey of the paper’s readership, regionally based in the western half of the U.S., Angus bulls represented 78.5% of the bull battery that producers intended to turn out with their cows in 2013, up from 61.4% in 2000.
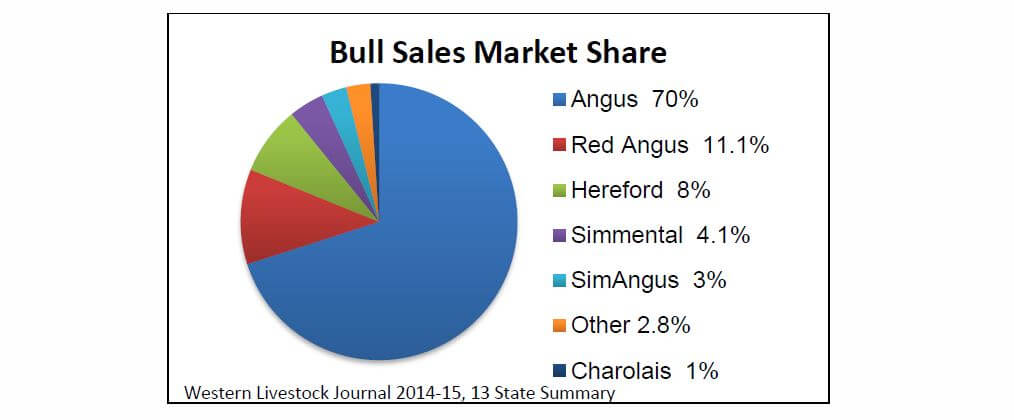
Further analysis of that data in 2015 summarized bulls sold at auction in 13 western states, classifying them by breed, head count and price (Figure 10). Angus made up 70% of the bulls sold, followed by Red Angus at 11.1% and Hereford at 8%. While this data only encompasses a portion of the western U.S., the analysis is an indicator of a recognized trend in which Angus bulls have been a predominant choice of cow-calf producers with a pattern of growing importance. Similar results were revealed in a December 2013 survey by BEEF magazine where 66.8% of survey respondents indicated that their most recent bull purchases were Angus bulls. Beef Today magazine also cites 2013 survey data in which 40% of producers were using “Angus only” in their bull battery while another 29% were using “Multiple breeds including Angus.”
Figure 10.
While not all bulls within the Angus breed or any other are genetically equal in marbling potential, the overriding Angus influence on the nation’s cow herd has exerted positive pressure on marbling based on the average of the breed for the trait. Updated data (2016) from the U.S. Meat Animal Research Center is telling in this regard (Table 2). As the table shows, Angus-sired calves born in 2014 had the highest mean marbling score compared to any of the other 17 sire breeds studied.
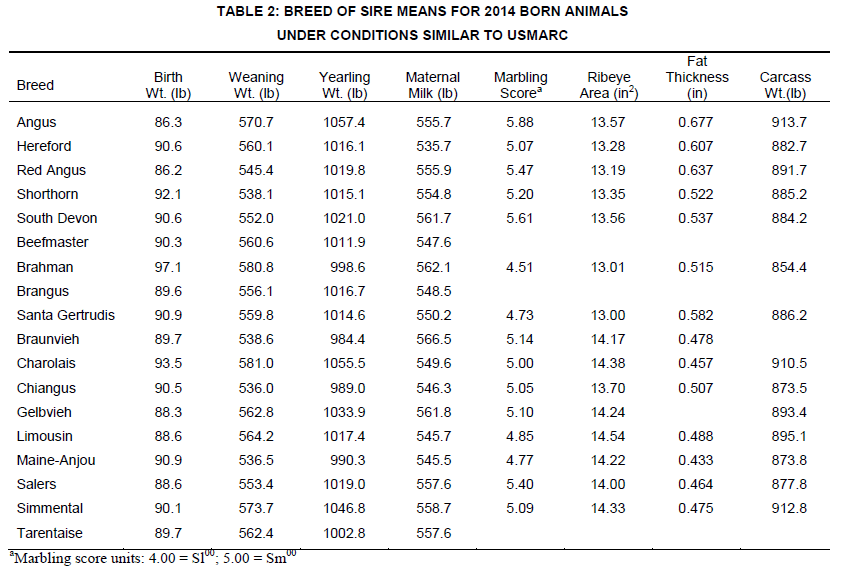
Source: Kuehn, 2016
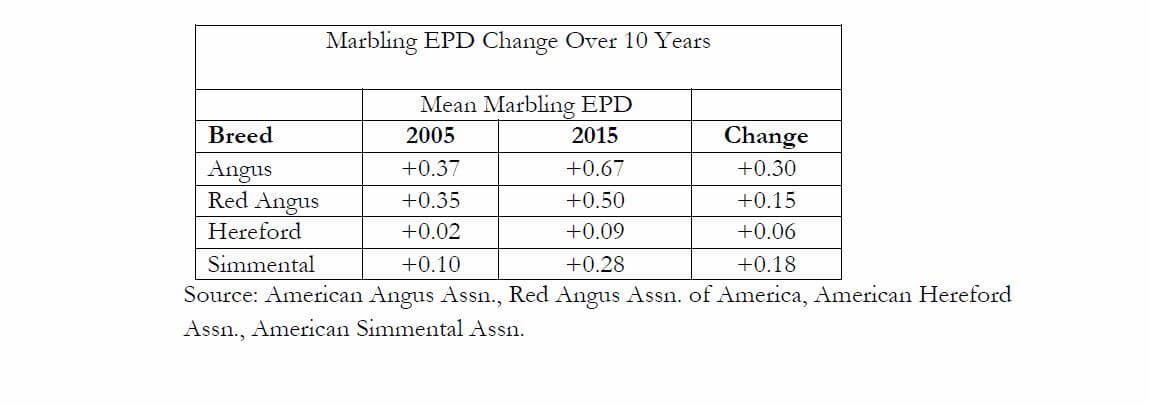
It is important to note that marbling progress in the past decade has been made not only in the Angus breed but also among other popular beef breeds (Table 3). As seen in the table, average marbling EPDs for all four of the most popular beef breeds based on market share sales summary have moved in a positive direction from 2005 to 2015. This trend data coincides with an 18- percentage-point increase in combined Choice and Prime grading for the same period. It is recognized that for biological reasons, any genetic improvement would have preceded the actual carcass outcomes by at least two years, and certainly more on a whole-herd basis due to generational turnover. This is a sign that seedstock producers in several breeds embraced the commercial market signals rewarding greater marbling levels and have consequently made breeding selections in pursuit of that end.
Eligibility of carcasses to be considered for the Certified Angus Beef ® brand and other USDA-certified Angus branded programs is primarily determined through the phenotypic requirement that animals be at least 51% contiguous black-hided (USDA). The resulting relevance of black-hided trends becomes important when evaluating eligible supplies of fed cattle for Angus-branded programs. Annual trends are shown (Figure 11) regarding black-hided cattle for all fed cattle as well as “native” U.S. fed cattle. The latter category is mathematically adjusted using USDA data to display only U.S.-origin beef breeds contributing to the fed cattle supply once Canadian and Mexican imports as well as dairy breeds are removed from the numbers.
The data show the black-hided percentage in the total fed cattle mix topped out at 64% in 2010 and has since settled into a range of 61-62% through 2016. The logical cause of this is reduced native U.S. fed cattle numbers subsequent to the drought-reduced U.S. beef cow herd beginning in 2012. The resulting fed cattle harvest during the period of 2012 through 2015 included a slightly larger proportion of non-black, dairy and imported cattle. While imports certainly contain a growing number of black-hided cattle, the percentage is smaller than in the native U.S. herd. The accompanying bars displaying only U.S. native black-hided trends show a 1-percentage-point increase in black-hided cattle since 2010, topping out at 76% in 2015. This analysis is additive to the discussion that the U.S. cow herd continues to be impacted by growing Angus and, as a result, black-hided genetic selection.
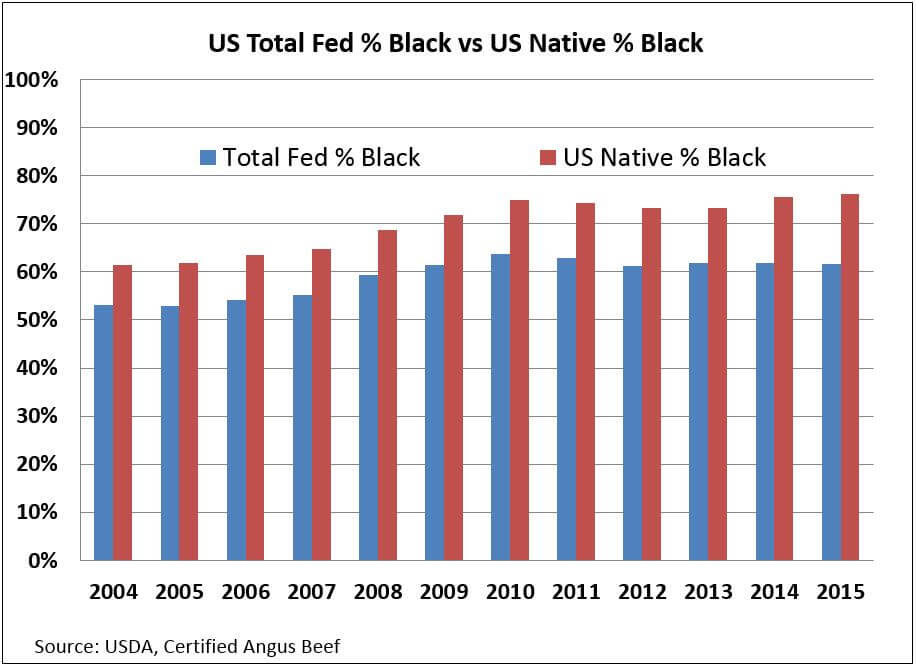
Source: Adapted from USDA, Certified Angus Beef LLC
Holstein Impact
Holstein fed steers and to a much lesser degree, heifers, comprised about 15% of the fed cattle mix from 2000 through 2010 (CattleFax). However, that percentage began to rise steadily from 2010 forward, primarily because of a drought-induced decline in U.S. beef cow numbers by 2012 and the subsequent decline in the number of native beef cattle in the fed cattle population. From 2011 to 2015 the annual total in fed cattle supplies dropped from 26.7 million to 22.6 million (Figure 12).
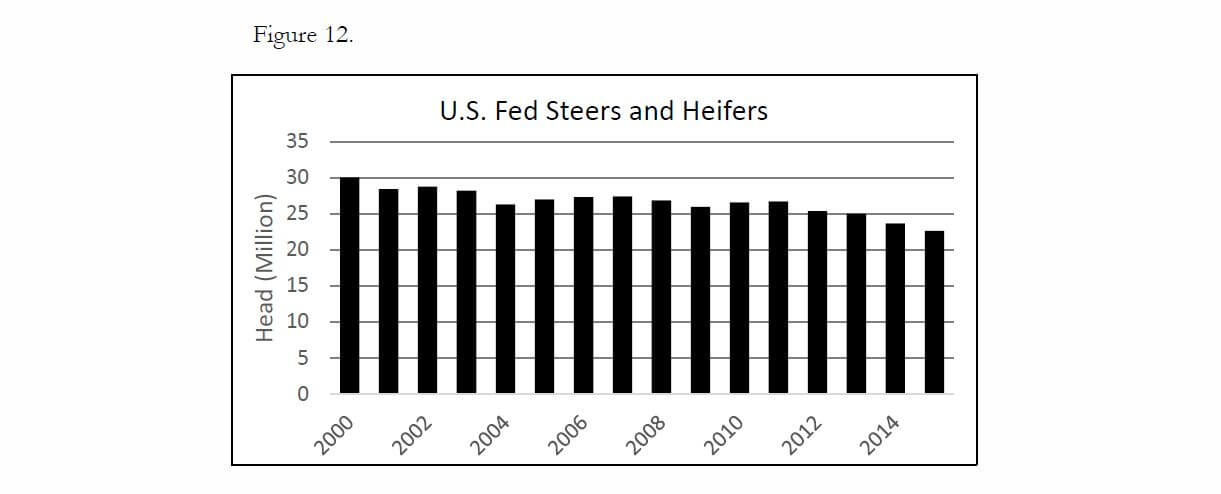
Source: USDA
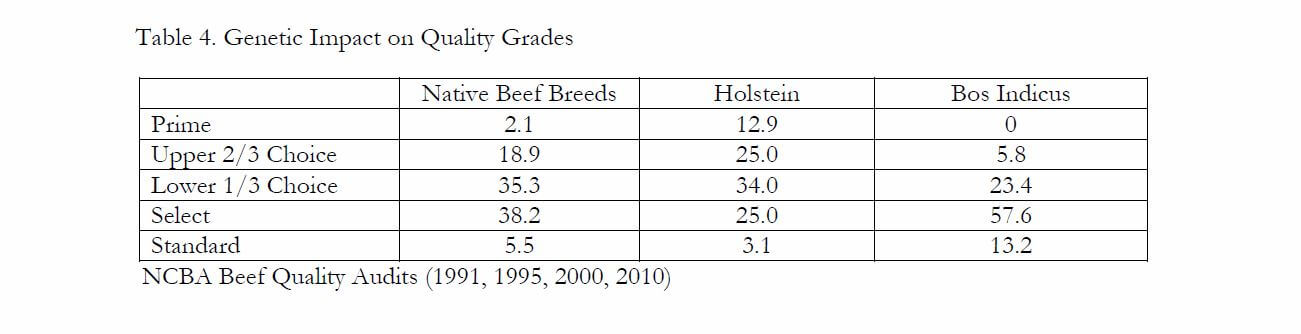
Estimates from 2015 data suggest that the Holstein share of the fed cattle population had grown to 19.5% (Boetel, 2016). Pooled NCBA Beef Quality Audit data spanning several years indicates that fed Holsteins achieve Prime quality grade rates at 12.9% as compared to native beef breeds which have averaged 2.1% (Table 4). As well, Holstein carcasses achieved upper-2/3-Choice quality grade levels at a rate of 25% compared to native beef cattle at 18.9%. Consequently, the increasing share of Holsteins in the fed cattle population and the accompanying impact on higher quality grades since 2012 must be considered as a contributing factor in the increased marbling trend.
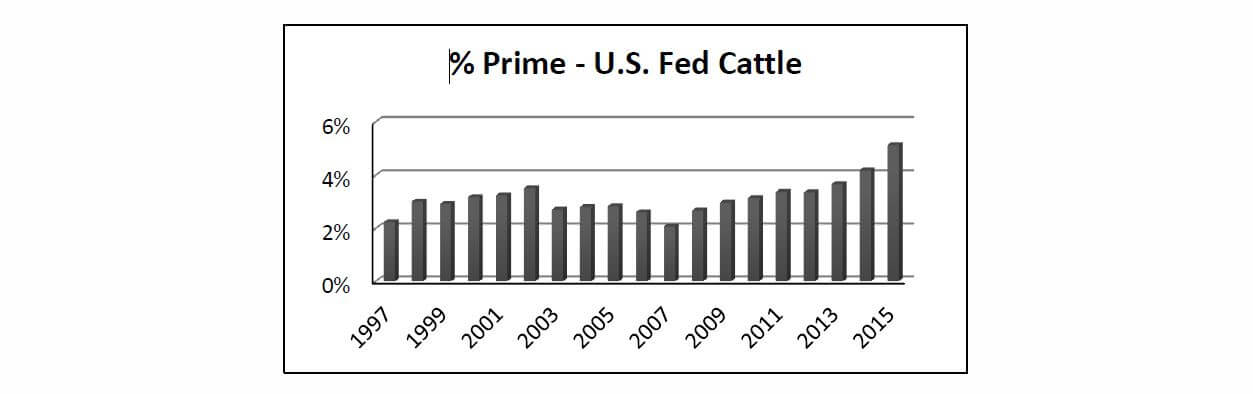
The Holstein contribution is especially important to the up-tick in the share of carcasses grading Prime. The chart shows Prime grading rates were stagnant in a range of 2% to 3% from 1997 to 2007 with an upward trend beginning in 2008 (Figure 13). The 2015 data shows an average Prime grading rate of 5.13% with continued progress carried into July 2016 for a mid-year number of 5.39%. Mathematically, the 2015 contribution of Holsteins to the fed cattle beef supply at the rate of 19.5%, coupled with a Holstein % Prime grading rate of 12.9% would have yielded a 39% contribution by Holstein cattle to the overall fed cattle Prime quality grade category.
Source: USDA
Drought Implications
The impact of widespread drought was felt across the country in 2012 as this historic event spurred massive cow culling. However, the Southwestern states were hit the hardest with more severe and long-lasting effects. Texas, the long-standing No.1 state for beef cow numbers, liquidated 1.2 million cows as a result of drought. Theoretically, the least desirable cows in terms of age and/or production capability would have been the target population for culling. When subsequent restocking of breeding females occurred in the following years, Texas and neighboring Southwestern states most likely upgraded genetics for many traits, including marbling, in the process. As well, with heifers being a likely source for many of those replacements, calving-ease Angus bulls were likely a popular sire selection.
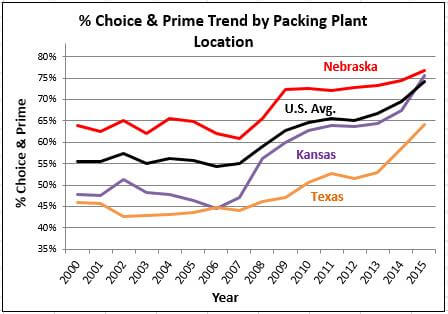
USDA quality grade data from the three highest volume packing capacity states in the country, Texas, Kansas and Nebraska, upholds the theory. Of the three, the collective Texas packers have long held the lowest Choice and Prime quality grade rates (Figure 14). However, cattle harvested in Texas showed the greatest improvement in % Choice quality grades from 2012 to 2015 in the three-state comparison with a 12% increase, followed by Kansas with a 10% increase and Nebraska with just a 3% improvement.
Source: USDA
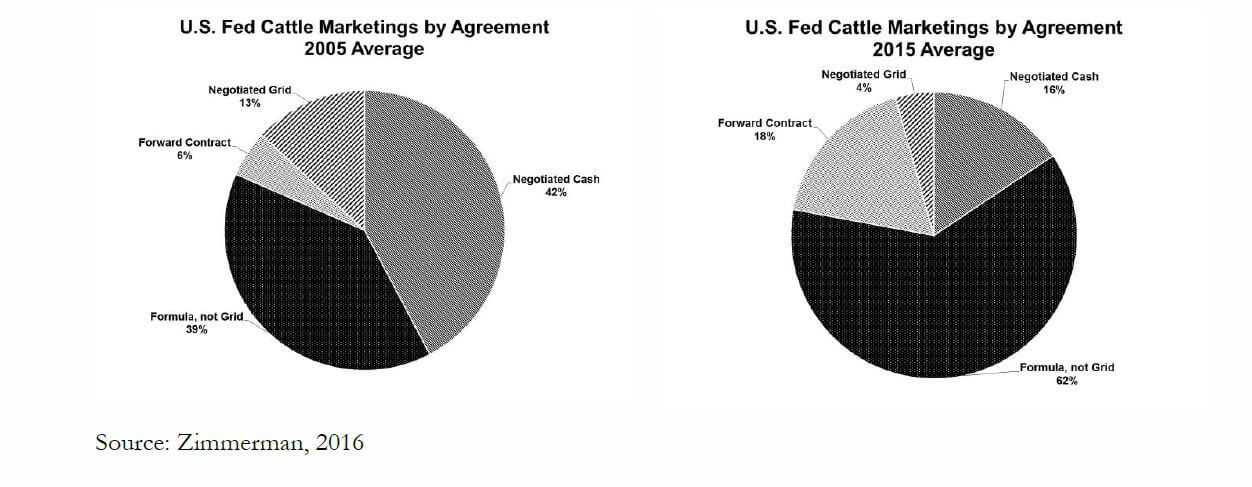
Grid/Formula Marketing
The structure of fed cattle marketing has transitioned a great deal in the past decade. In 2005, approximately 40% of fed cattle were bought and sold on a negotiated cash basis while an additional 40% were marketed on a formula agreement between feedyards and packers (Figure 15; Zimmerman, 2016). During the next 10 years, formula agreements grew to upwards of 60%, often reaching 70% of all fed cattle transactions from 2012 through 2015. At the same time, negotiated cash transactions declined to roughly 20% of the transaction types in 2015.
Negotiated grid pricing, as defined by USDA, has declined from a 2005 level of 15% to only about 5% in 2015. However, it is difficult to quantify the 60% of USDA-defined formula transactions that contain some type of carcass quality specification as terms of the formula. The numerous versions of formula agreements that exist make it too complicated to properly classify them so as to know how many are oriented in some way around a carcass quality or yield standard. Even so, the migration toward formula pricing arrangements signifies a similar movement toward carcass-based pricing as opposed to live animal-based marketing. Also, given the fact that incremental cost of carcass weight gain at the end of the feeding period is more economical than that associated with live weight gain, additional days on feed and heavier carcass weights are more profitable when selling on a carcass weight basis (Bondurant, et. al., 2016). Logically, a shift toward formula pricing has encouraged heavier carcass weights and additional days on feed, bringing along increased marbling and quality grades in the process.
Figure 15.
The premium and discount structure of carcass value-based grids offered by packers has incentivized higher marbling levels since their more widespread use in the 1990s (Table 5). A more recent historical look at USDA grid pricing data shows a fairly stable but increasing market signal for quality grades Choice and Prime as well as Certified Angus Beef ® branded product. It is important to point out that, while some years show downward movement in those premiums, the growing percentage of higher quality grade and CAB® product in the steer/heifer carcass mix has been relatively dramatic during that timeline.
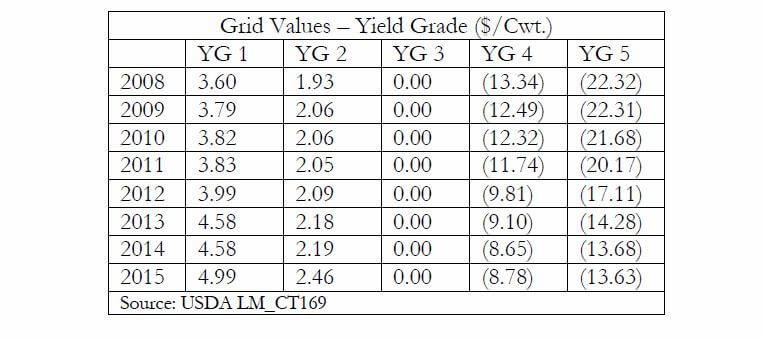
The YG premium and discount data (Table 6) illustrates further stable and slightly increasing premiums for YG 1 and 2 carcasses since 2008. However, there is a notable decline in the discounts associated with YG 4 and 5 carcasses over those 8 years. An argument can be made that packers reduced discounts on undesirable yield grades in order to allow feedyards to finish cattle at heavier carcass weights and more desirable quality grade levels.
Clearly, the most valuable carcasses combine both numerically lower yield grades, higher quality grades and CAB® brand acceptance rates. As well, YG 1 carcasses in 2015 jumped up to a $4.99/cwt. premium, indicating a reduction in supply of that leanest YG category. However, as we look toward the more plentiful, realistically achievable categories of YG 2 through 4 in each year of the data, a CAB®/YG 3 carcass was more valuable than a Choice/ YG 2 carcass, indicating that quality remains the driver as we look at average industry-wide value based pricing.
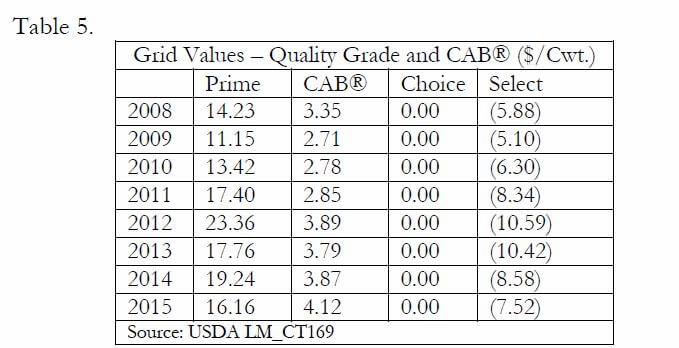
Table 6.
Annual and seasonal supply and demand fundamentals change the price spreads between Select, Choice, Premium Choice and Prime. However, the grid premium for Prime carcasses in 2015 averaged $16.16/cwt., compared to $17.40/cwt. in 2011, while Prime production in 2015 was 140% of the 2011 tonnage. CAB® grid premiums in 2015 were also the strongest on record, at $4.12/cwt., building on years of demand growth.
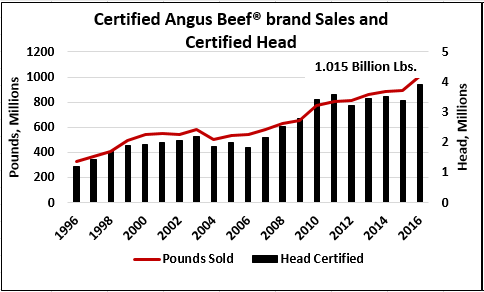
Certified Angus Beef ® brand sales volumes have grown to set new annual records in 10 consecutive years through the 2016 fiscal year (Figure 16; Certified Angus Beef LLC, 2016).
Source: Certified Angus Beef LLC, 2016
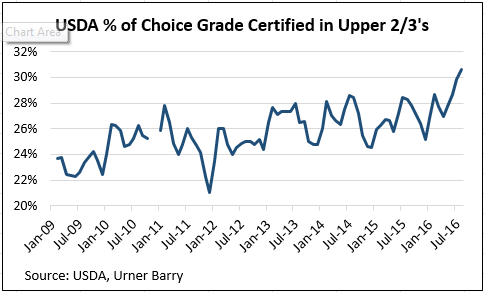
This is due in large part to a higher percentage of eligible carcasses (roughly 62% of all harvested cattle meeting the USDA definition of “Angus-type”) qualifying for the brand, topping 27% that year. Marbling advances not only benefited the Certified Angus Beef ® brand, but a record proportion of Choice-graded carcasses through the third quarter of 2016 were certified by USDA graders into all USDA certified Premium Choice branded beef labels (Figure 17).
Figure 17.
Heavier carcass weights coupled with higher average marbling levels in fed cattle pushed CAB®-qualified carcass tonnage higher in 2015 and the first half of 2016 than ever before. The increase in marbling and quality grade achievements by the beef industry as a whole have increased the availability of premium quality product and decreased the share of Select and Standard grade product. Even so, the CAB® spot market boxed beef price differential above Choice averaged $15.05/cwt. from January through July of 2016 (Urner Barry, 2016). The consumer and end-user message to the industry has continued to shift toward higher demand for quality, highly marbled beef products, even under the framework of a higher overall quality offering.
Impact of Dried Distillers Grains
Corn distillers’ co-products (co-products) have been the subject of much discussion and analysis since the dawn of the “ethanol era” with co-products increasingly used in feedlot rations by 2006. As the previously discussed decline in carcass quality grades hit a low in 2006, a degree of concern formed around co-products and their potential negative impact on marbling (Corah and McCully 2006). A meta-analysis by Reinhardt and DiConstanzo (2006) revealed that co-product inclusion up to 20% (DM) of the diet did not, however, negatively impact marbling when cattle are finished at higher YG endpoints. Further research by Nuttleman, et. al. (2011) indicated no marbling differences between a control group versus cattle fed co-products at levels of 20%, 30% and 40%. However, carcass weight and backfat thickness were both higher for cattle fed any of the three levels of co-products when compared to those not fed co-products for the same duration.
While many diets included higher levels of co-products, particularly as corn prices escalated in 2008 and again in 2010, nutritionists learned about the risks of polioencephalomalacia at levels above 40% dry matter inclusion. Furthermore, the economic return to substituting corn with dry co-products begins to fade at the 20% level and decline past the 30% inclusion level, according to a study by Erickson, et. al., 2007 (Figure 18).
Figure 18. Economic return from feeding Distillers Dried Grain Solubles at 0, 10, 20, 30, 40% of diet DM, 60 miles from ethanol plant at $2.70, $3.70, or $4.70/bu. corn
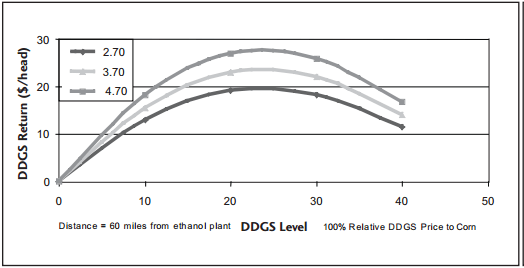
Source: Erickson, et. al., 2007
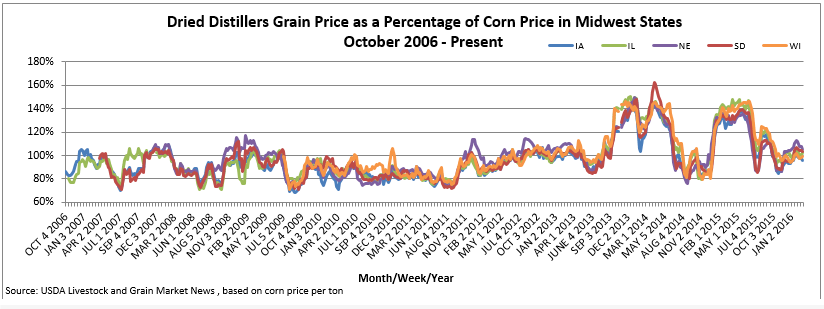
From 2006 to 2011 co-products were priced primarily between 75% and 100% of the price of corn (Figure 19; USDA 2016). That changed in late 2011 with spikes above 140% from 2013 to 2015. The co-product-to-corn price ratio varied a great deal in those years, but moved in favor of corn and against co-products. Even though co-product inclusion levels may have declined from 2013 to 2015, research suggests that co-products, when fed at rates most commonly deployed in the feedlot sector, are likely not having a large impact on quality grades.
Figure 19.
Changes in Growth Technologies
A discussion about quality grades from 2007 through 2016 would not be complete without mention of growth enhancing technologies. Of particular note is the adoption of beta agonists during the early portion of this timeframe and their wider acceptance by industry up to the fall of 2013. Beta agonists created a new and unique management option where cattle could be fed longer, achieving heavier carcass weights, larger ribeye areas and numerically lower yield grades with more efficiency than would have otherwise been seen without their use at the same carcass weights and feeding durations (Montgomery, et. al., 2009). Any impacts to quality grade that ZilmaxTM, in particular, may have had on total fed beef quality grades, including its removal from the market, were likely masked by the annually increasing carcass weight, days on feed and improved genetics that are apparent in the data during that timeline. Even as ZilmaxTM was voluntarily removed from the market in the fall of 2013 due to welfare concerns, feedyards were relatively quick to replace the product with the competing Optaflexx® beta agonist product. Feedyard managers also migrated from the lower dose, 200-milligram Optaflexx® product to the 300-milligram dose, allowing for extended feeding periods and heavier finished weights to continue to be realized.
Another advancement in growth technology, Revalor® XS, launched in 2007, provided cattle feeders an implant that would deliver an immediate first and delayed second dose of TBA and estradiol.The product not only eliminated additional labor and stress on cattle during the feeding period, but solidified the fact that cattle could receive a long-acting implant that would be efficacious through the feeding period. This would have also partially dissuaded feedlot managers from marketing cattle early as they may have done with a traditional implant program had they chosen to forego a second implant in favor of an early harvest date in certain market environments. Research shows that use of Revalor® XS, the first delayed-release implant of its kind, results in improved quality grades when compared to a combination of two similarly dosed implants (Parr, et. al., 2011). We must also consider crediting this advance in implant technology with some of the marbling improvements since the product’s release, coinciding with earnest marbling improvements since 2006.
Summary
The U.S. fed beef supply has experienced an unprecedented improvement in carcass marbling levels over the past decade. Cattle management strategies continue to offer several impact points to either protect or degrade genetic marbling capabilities of fed steers and heifers. The industry’s typical annual advance of 5.5 lb. of carcass weight has provided natural inertia toward higher quality grades, along with added days on feed. However, genetic progress through Angus influence as well as selection for higher marbling cattle throughout the cattle population is evident. As most recent market trends prove, demand for Premium Choice and Prime carcasses is very high among a product mix that is of the highest marbling quality we’ve seen in modern history. As we move into a period of cow herd expansion, the question and challenge that remains is whether ample supplies and cheaper beef prices will continue to reward marbling in a marketplace consisting of a marbling-rich product mix. The most likely answer is that, not only will the market continue to differentiate on quality, but beef demand would entirely fail without it due to the ever-present competing proteins that are substantially cheaper. Consequently, the industry must continue to drive out cost while protecting the eating attributes that make beef the most preferred protein.
Special Thanks
The author would like to acknowledge the valuable assistance of fellow Certified Angus Beef LLC staff members Larry Corah, Mark McCully, Justin Sexten and Steve Suther.
Work Cited
American Angus Assn. 2016. Genetic trend EPD/$Value by birth year. https://www.angus.org/Nce/GeneticTrends.aspx. (Accessed 20 September 2016)
American Hereford Assn. 2016. Pan American Hereford Cattle Evaluation. Genetic trend. EPDs as of October 15, 2016. https://www.hereford.org/userfiles/Oct2016Trend.pdf. (Accessed 20 October 2016)
American Simmental Assn. 2016. Genetic trends. Trend data. https://herdbook.org/simmapp/template/trends,TrendIndex.vm. (Accessed 15 September 2016)
Anderson, P. T., Gleghorn, J. 2007. Non-genetic factors that affect quality grade of fed cattle. Proc. Beef Improvement Federation. Fort Collins, CO. p. 31-43
Beef Magazine. 2014. U.S. Beef Herd is Mostly Black but Changing Slightly. https://www.beefmagazine.com/cattle-genetics/us-beef-herd-mostly-black-changing-slightly. (Accessed 15 July 2016)
Beef Today. 2014. Survey details Angus influence. http://www.agweb.com/mobile/article/survey_details_angus_influence_naa_beef_today_guest_editor/. (Accessed 25 June 2016)
Belk, K. E., Woerner, D. R. 2008. The history of instrument assessment of beef. Cattlemen’s Beef Board and National Cattlemen’s Beef Association.
Boetel, B. L. 2016. Personal communication.
Bondurant, R. G., MacDonald, J. C., Erickson, G. E., Brooks, K. B., Funston, R. N., Bruns, K. 2016. Carcass gain, efficiency, and profitability of steers at extended days on feed. In: 2016 Nebraska Beef Cattle Report. Rep. No. MP103. Univ. of Nebraska, Lincoln. p. 91-95.
CattleFax. 2015. 2016 Outlook and strategies. U.S. protein outlook. Denver, CO.
Cattle Fax. 2016. 550 lb. steer prices (weekly). http://www.cattlefax.com/data.aspx. (Accessed 7 September 2016)
Cattle Fax. 2016. Fed steer prices (weekly). http://www.cattlefax.com/data.aspx (Accessed 7 September 2016)
Certified Angus Beef LLC. 2016.
Corah, L. R., McCully, M. A., 2010. Declining quality grades: A review of factors reducing marbling deposition in beef cattle. Certified Angus Beef white paper.
Erickson, G. E., Bremer, V. R., Klopfenstein, T. J., Stalker, A., Rasby, R. 2007 Feeding of corn milling co-products to beef cattle. In: 2007 Utilization of Corn Co-Products in the Beef Industry. 2nd Edition. Nebraska Corn Board and Univ. Nebraska, Lincoln Inst. Of Agriculture and Natural Resources Agricultural Research Div. p. 17
Herring, A. D. 2006. Genetic aspects of marbling in beef carcasses. Certified Angus Beef white paper.
Kuehn, L. A. 2016. 2016 across-breed EPD table. Personal communication.
Montgomery, J. L., Krehbiel, C. R., Cranston, J. J., Yates, D. A., Hutcheson, J. P., Nichols, W. T., Streeter, M. N., Bechtol, D. T., Johnson, E., TerHune, T., Montgomery, T. H. 2009. Dietary zilpaterol hydrochloride. I. Feedlot performance and carcass traits of steers and heifers. J. Anim. Sci. 87:1374-1383. Smith, K. R., Ransom, J. R., Yates, L., O’Connor, M. E. Instrument augmentation of USDA beef carcass grading system. 2006. In: Proc., 59th American Meat Science Assn., Champaign-Urbana, Illinois. P. 41-42. doi:10.2527/jas.2008-1162
NCBA Beef Quality Audits. 1991, 1995, 2000, 2010.
Nuttleman, B. L., Griffin, W. A., Benton, J. R., Erickson, G. E., Klopfenstein, T. J. 2011. Comparing dry, wet, or modified distillers grains plus solubles on feedlot cattle performance. Nebraska Beef Cattle Reports. Paper 619.
Owens, F. N., Gardner, B. A. 2000. A review of the impact of feedlot management and nutrition on carcass measurements of feedlot cattle. J. Anim. Sci. 77:323-329.
Red Angus Assn. of America 2016. EPD trends (Fall 2016) https://www.redangus.org/genetics/epd-trends. (Accessed 15 September 2016)
Reinhardt. C. D. 2006. Personal communication.
Tonsor, G. T., Dhuyvetter, K. C., July 2013. Historical and projected Kansas feedlot net returns. K-State Dept. of Agricultural Economics. Pub. AM-GTT-KCD-KFR-7.2013. www.agmanager.info/cattle-finishing-returns-30. (Accessed 13 July 2016)
Tonsor, G. T., Dhuyvetter, K. C., March 2014. Historical and projected Kansas feedlot net returns. K-State Dept. of Agricultural Economics. Pub. AM-GTT-KCD-KFR-3.2014. www.agmanager.info/cattle-finishing-returns-22. (Accessed 13 July 2016)
Streeter, M. N., Hutcheson, J. P., Nichols, W. T., Yates, D. A., Hodgen, J. M., Vander Pol, K. J., Holland, B. P., 1987. Review of large pen serial slaughter trials – growth, carcass characteristics, feeding economics. J. Anim. Sci. 65:1381-1391. doi:10.2527/jas1987.6551381x
Walter, S. T., 2016. Historical feedlot cost of gain. Personal Communication.
Urner Barry. 2016. USDA Percentage of the choice grade certified in the upper 2/3. https://www.ubcomtell.com/History/7967. (Accessed 10 October 2016)
Urner Barry. 2016. UB beef cutout – 600/900 total carcass value CAB. https://www.ubcomtell.com/History7649. (Accessed 17 August 2016)
Urner Barry. 2016. UB beef cutout – 600/900 total carcass value Choice. https://www.ubcomtell.com/History/7638. (Accessed 17 August 2016)
USDA. 2016. Schedule GLA – November 1996. USDA Specification for characteristics of cattle eligible for approved beef programs claiming Angus influence. rev. 19 January 2016. Agricultural Marketing Svc. Livestock, Poultry and Seed Div. Washington, D.C. 20250
USDA. 5 Area Weekly Weighted Average Direct Slaughter Cattle. https://www.ams.usda.gov/mnreports/lm_ct150.txt. (Accessed weekly, January 2008 – June 2016)
USDA. 5-Area weekly wtd average direct slaughter cattle – premiums and discounts. https://www.ams.usda.gov/mnreports/lm_ct169.txt. (Accessed weekly, 2006-2016).
USDA. Actual slaughter under federal inspection. http://www.ams.usda.gov/mnreports/sj_ls711.txt. (Accessed weekly, January 2009 – August 2016)
USDA AMS. 2010-2015. National summary of meats graded. http://www.ams.usda.gov/reports/meat-grading. (Accessed 10 August 2016)
USDA. National steer & heifer estimated grading percent report. http://www.ams.usda.gov/mnreports/nw_ls196.txt. (Accessed weekly, January 2000 – August 2016)
USDA, NASS. Livestock Slaughter Annual Summary. 1995-2015. http://usda.mannlib.cornell.edu/MannUsda/viewDocumentInfo.do?documentID=1097 (Accessed 9 September 2015)
USDA. National steer & heifer estimated grading percent report. https://www.ams.usda.gov/mnreports/nw_ls196.txt. (Accessed weekly 2009-2016)
USDA. Weekly National Grain Market Review. https://www.ams.usda.gov/mnreports/sj_gr851.txt. (Accessed weekly, February 2011 – June 2016).
Western Livestock Journal. 2014. 2014 bull survey. Ipsen, L. Personal communication.
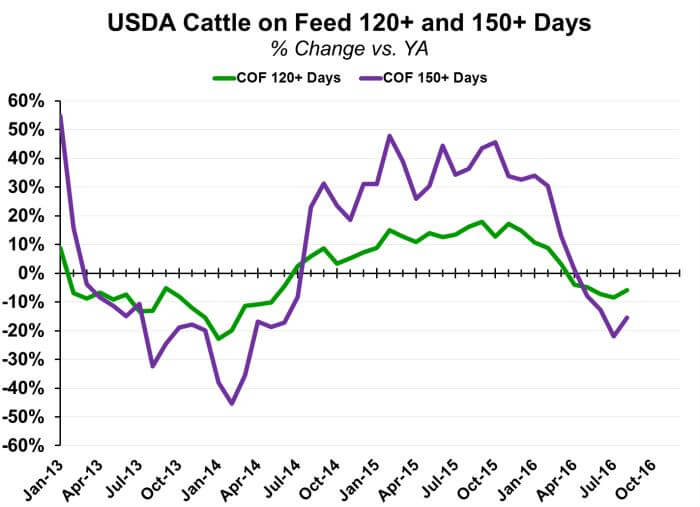
Zimmerman. L. 2016. Cattle on feed 120+ and 150+ days, % change vs. year ago. Personal communication.
Zimmerman, L. 2016. Personal communication.